event-visualizer
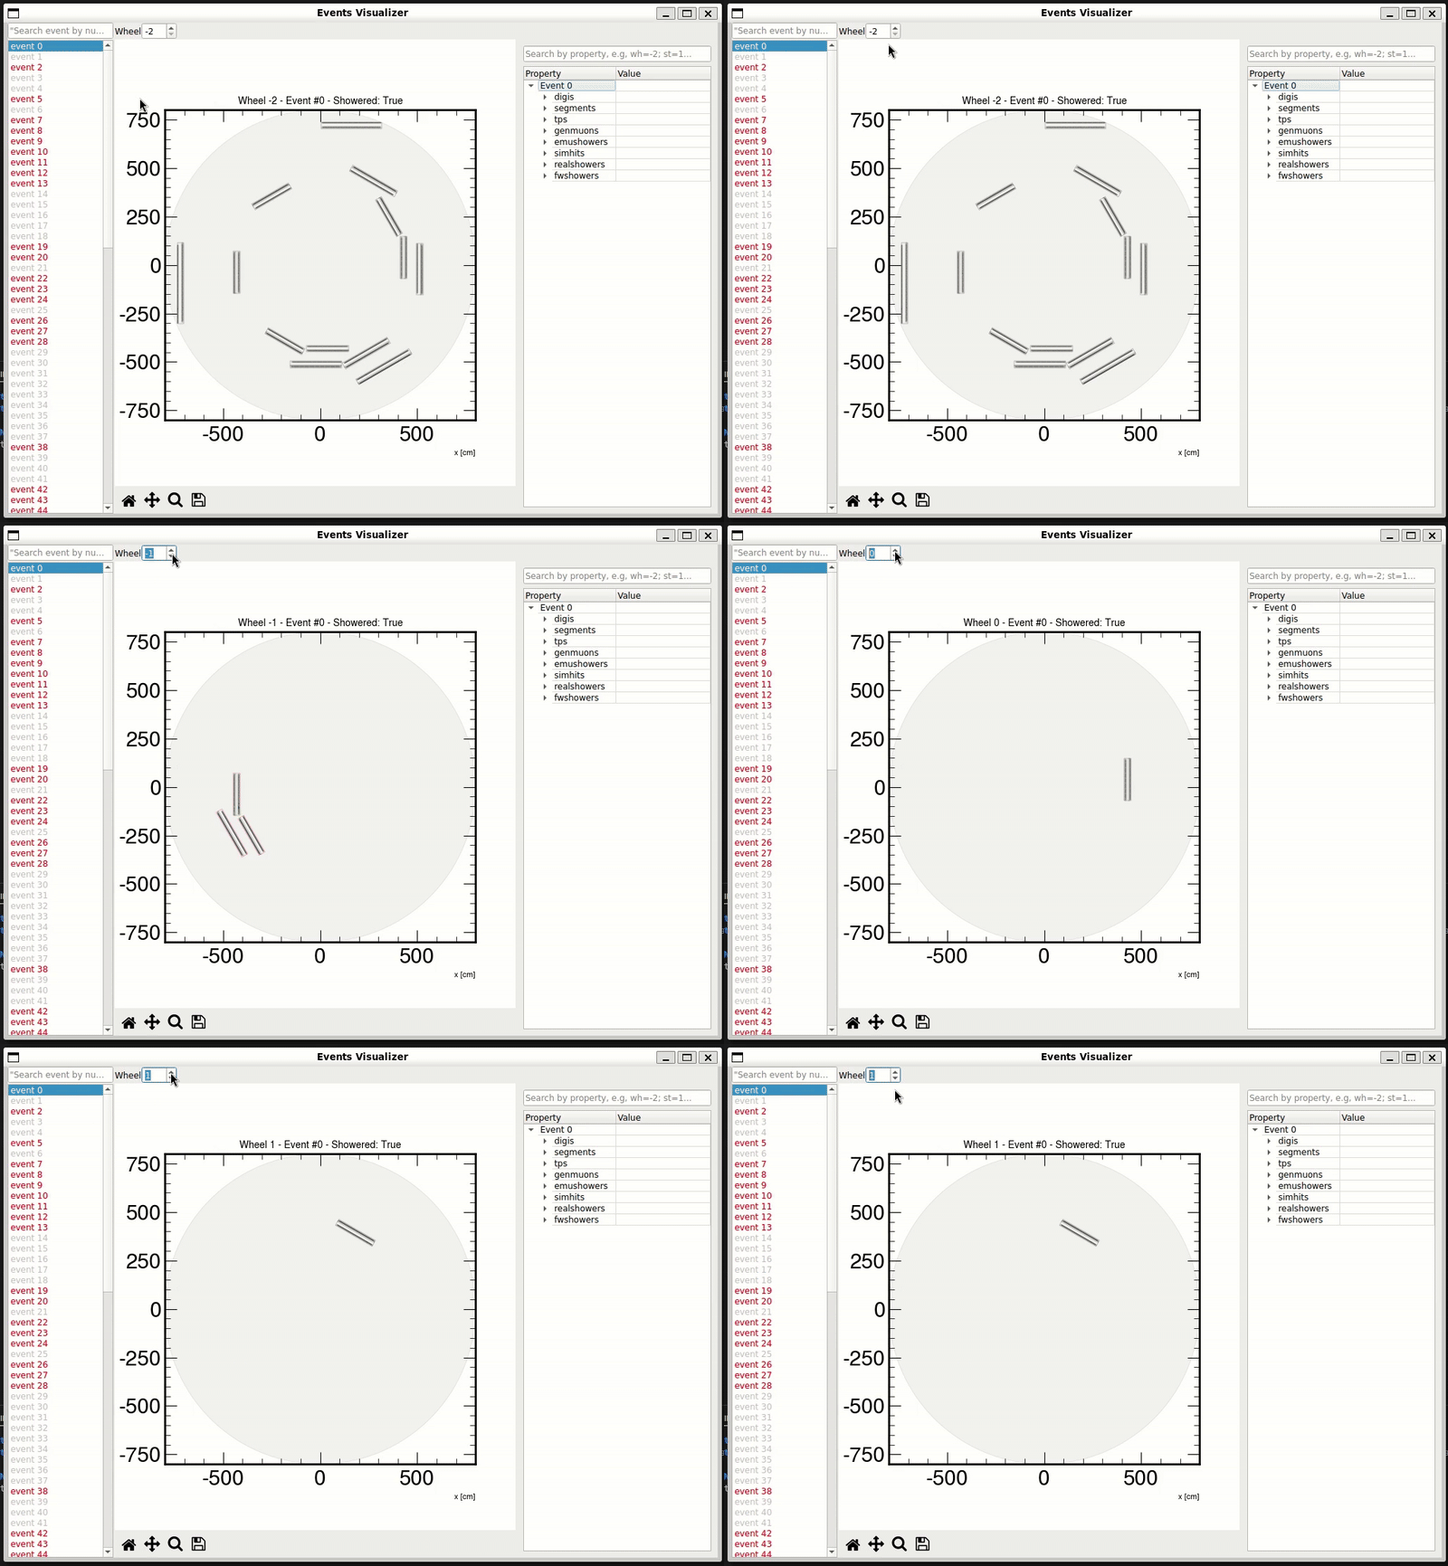
For debugging or performing multiple visual inspections across several events or DT chambers, running the previous command each time can be cumbersome. To streamline this process, a simple Graphical User Interface (GUI) was implemented. This GUI dynamically loads event information and produces the required plots, as demonstrated in the following short clip.

To open the GUI, run the following command:
dtpr event-visualizer -i [INPATH] -cf [CONFIG]
Warning
The GUI was primarily designed for debugging purposes. So, it is not cleanly implemented yet and may crash easily or not work as expected.